As you must have seen in several of our blogs, we are working with a WebGIS. What is even better is that this WebGIS is open access. You can see our work happening in real time! Collecting the information, writing it up and adapting it to the WebGIS format requires time and, moreover, it is only a part of our work. But, in any case, today we are going to explain what WebGIS is, how we work in it and how it works, since it has several features and particularities that deserve to be collected in more detail in a specific post.
Introduction of the WebGIS
First up, the WebGIS itself. The WebGIS is created by Frédéric Pouget at the University of La Rochelle. It is a good example of using the existing structures of the university within a project. The development of the webGIS was part of a course taught by Frédéric, where students build the database as part of their assignments. This way we get our database and students get the needed experience in creating such a database, and get to see their work in action. Rather than doing an assignment just for the sake of doing an assignment.
Our database is hosted by the Huma-Num of the Centre national de la recherche scientifique (CNRS). This initiative of the French government must be applauded. Contrary to the standard approach, where datasets go offline after a project ends due to the lack of funding, Huma-Num continues hosting the database. This way scholars can still consult and use the database well after the end of our project.
A major novelty of our project is the combination of archaeological and epigraphic sources in one WebGIS. Mostly we see that these sources are found in separate databases, if they are found in open access databases at all. By combining both sources we aim to gain a deeper understanding of the city (lay-out, use etc) and its social structure. Both fields are quite different and we, Ada and Pieter, work together to get the best out of our data.
Archaeological study in a WebGIS
As we indicated at the beginning, collecting, synthesizing and writing the information in a way that is appropriate for WebGIS is a very time-consuming job. This is especially true in the case of archaeological remains, since we rarely have other databases to which we can access and from which we can extract the information. Precisely one of the great contributions of our project is this, to gather a huge amount of information, updated and contextualized, on the urban phenomena in Late Antiquity.
So, at the archaeological level, the research begins with what we can call the old school style, with an exhaustive search of the most significant publications of the city we are analyzing at that time. This allows us to get an idea of the state of the question today and to have the most complete and recent bibliography possible. This sounds like a simple task, but one of the main challenges is, in fact, to gather the available information, as it is often scattered in different and varied publications, so it is not always easy to get hold of all the bibliography. Fortunately, we can always count on our colleagues collaborating on the project to give us a hand in this task.
Once we have a bibliography as complete and recent as possible, it is time to read and analyze it carefully to obtain specific data of interest for our project. We want to know what buildings, infrastructures and topographic elements made up the urban landscape of our study cities throughout the five centuries of Late Antiquity. The analysis is done vestige by vestige, so that in parallel we can synthesize and write the information adapted to the WebGIS format. This information is initially collected in an Excel file to facilitate export to the database. However, we have not yet been able to export all this information en bloc, so the items are entered manually for the time being. We hope to be able to apply a system similar to the one used in the epigraphic part for the next case studies.
Finally, once the necessary information on the vestige in question has been synthesized and written (description of the vestige, state of conservation and chronological discussion), we search for the graphic apparatus to complete the record. Photographs, plans, sections or reconstructions are also included in the archaeological vestige files not only to facilitate the understanding of the archaeological remains, but also because this graphic documentation also serves as a starting point for our colleagues in charge of 3D modelling and reconstruction for the ATLAS travelling exhibition.
Epigraphic study in a WebGIS
The epigraphic part of the project uses a completely different approach. Thanks to the existing databases (e.g. Trismegistos, EDH, EDCS, HEpOnl and LatinNow) the individual study of each item through a multitude of publications is not needed. Some of these datasets are open source and allow scholars to download the data. Whereas for others there might be a work around… By combining the data available through these different dataset we already gain an improved epigraphic dataset. This combination of dataset is possible thanks to Trismegistos’ dataset holding the Id’s of most large databases. This way we can cross link to data from the different datasets. However, even after combining the data of the datasets, often we are still left with partial data. Moreover, and more importantly for our WebGIS, spatial data is only given on city level. That is, for Carthago we have over eight thousand inscriptions in the Claus-Slaby database, all given one representative centroid (point on the map).
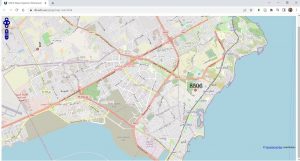
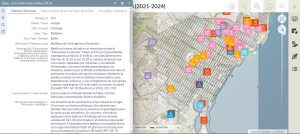
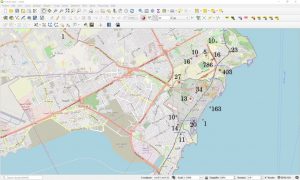
Of course, such an approach is useless for the study of individual cities. Often epigraphers turn to small case-studies and then spend loads of time to ascertain the location of individual inscriptions. Seldomly these efforts make it into databases. However, part of improving our data for the WebGIS includes the improvement of the spatial data. While going through the publications we search for the find spot of the inscription. This way we are able to assign the inscriptions on building level. The map below shows how we located the over two thousand Late Antique inscriptions of Carthago within the city. Note the 163 inscriptions in the sea lack a known location, other than Carthage. Up till now we haven’t solved the problem of how to deal with unlocated epigraphy. Often a drop-site is chosen for these. We decided that the drop-sites are in the water, hopefully making clear that it is a drop-site.
While searching the epigraphic publications to improve the spatial data we also improve the data on material, object and text type. Clearly, one of the most challenging aspects is dating the inscriptions. Thanks to the combined datasets and the publication of epigraphic collections working on the epigraphy can be done in bulk. This means that the epigraphy is not entered into the database inscription per inscription, but in larger samples. We did Carthage in one go. Soon we will finish and upload the other four case studies of the Maghreb.
Using the WebGIS
The WebGIS is already available for all to see via: https://geoapps.huma-num.fr/adws/app/5b1c0f10-7386-11ec-b348-11e51a07f6b0/
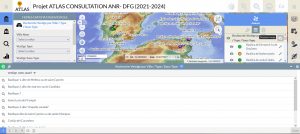
The start screen might at first look a bit overwhelming, this blog will walk you through. You will see that it is not complicated at all and you will quickly get used to the interface!
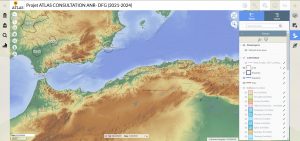
On the right hand side we find the map layers panel. Here we can switch layers on and off. In the overview we only see the ‘territories’, or ‘cité’, of the ten case study cities. When zooming in on one of the cities other layers become available. We can zoom in using different methods. The most intuitive is the scroll button on our mouse. However, there are two options in the webGIS itself: (1) On the left hand side we find the + and – for zooming, the arrows allow you to switch between the last two zoom levels. (2) the last icon in this row is a quick zoom function by creating a square box. Select this icon, it will turn blue, and left click and drag on the map to select the area you want to zoom in. Note the box indicates the zoom level, thus it will show what was within the box you dragged.
When we zoom in on for example Carthage, we note that the ‘cité’ and ‘enceinte’ disappear, whereas the icons of the archaeological ‘vestiges’ appear. The epigraphic layer needs to be manually activated.. On the right hand panel we see a section with base maps. Here we can switch on and off several basemaps and play with their transparency. So far playing with layers and the right hand panel.
On the left we find four icons: (1) The temple or better ‘Filtre Carto Vestiges’; (2) the monument or better ‘Filtre Carto Inscriptions’; (3) Magnifying glass or ‘Recherches’; (4) Graphs or ‘Statistiques’. Each of these allows you to search and query the database.
Filtre Carto Vestiges
This is a function that offers two options, apparently similar, but that make it possible to query the database from different perspectives. The first option (‘Recherche Vestige par Ville / Type / Sous-type’) offers searches within each city by type and even subtype of archaeological element. The interesting thing about this function is that none of the search items is mandatory, so that quite free queries can be made, even without sticking to a single city. Thus, we can have a list of all the archaeological elements by type (civic, religious, economic, etc.) or subtype (churches, dwellings, baths, necropolis, etc.) collected in our database. In fact, the results of this and all other search options generate a list on the right side, which can be displayed as a table and facilitates access to the data sheets of each vestige. Eventually, these tables can be downloaded in different formats to work with the data in the way that suits us best.
The second option (‘Recherche Vestige par Ville / Sous-type / Siècle’) is focused on specific queries by century, so this variable is mandatory when searching. In this way we can filter archaeological items chronologically, as well as by city or subtype if we wish. This is a good way to observe evolutionary patterns by specific categories of remains and/or buildings, both in a specific city and in the project’s case studies as a whole.
Filtre Carto Inscriptions
The search function for epigraphy gives four ways of searching the epigraphy. We can search the epigraphic record with the ‘Recherche Inscription’, which allows us to narrow down our searches using filters per city, text type, dating or description. By combining the filters we can get some fine detailed searches.
The ‘Recherche Langue Inscription’ is rather straightforward. You can select the language of the inscriptions. Note that the search is exact, thus Latin will only yield Latin and leave out the Greek/Latin and Hebrew/Latin.
‘Recherche Chronologique Inscription’ gives you the possibility to map out the inscriptions dated to specific centuries by switching on and off the layers. Note that this is a broad search, that is all inscriptions with the century mentioned are shown. For example an inscription dated within the range of the third to the fifth century will show up in all three centuries. The unspecific Antiquité tardive will only show with that layer enabled.
The ‘Recherche ID Inscription’ is a useful way to single out that one inscription you were working on. With the ID of the inscription in our database you can easily focus on that one text.
On the other hand, we take this opportunity to let you know that we are working on more types of searches, specifically for the text within the inscriptions, based on a refined version of the edited text and on the search for references. We will keep you posted!
Recherches
Following this line of constant improvement are the various search functions that we find within the magnifying glass icon (‘Recherches’). In some cases, in fact, they have been suggested by our own colleagues in the project, such as the search by keywords in both buildings (‘Recherche Edifice par mots clés’) and inscriptions (‘Recherche Inscription par mot clé’). As we said, these are functions that we are still developing, but we hope to make them fully available very soon. The rest of the search options work as we have already explained, both in the epigraphic and archaeological fields.
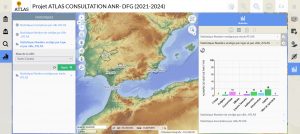
Statistiques
The ‘Statistique’ panel gives us at the moment a few graphs to show the data in rough overview and compare our ten case study cities. Obviously as it is work in progress it only shows what is already entered. Even so, it is a useful tool to observe evolutionary trends at a chronological level or even to know, at a quick glance, what types of vestiges characterise each of the cities in our project.
In the near future we will add this description to the webGIS interface and we might even get a French video explaining how to do this. We hope you find it useful!