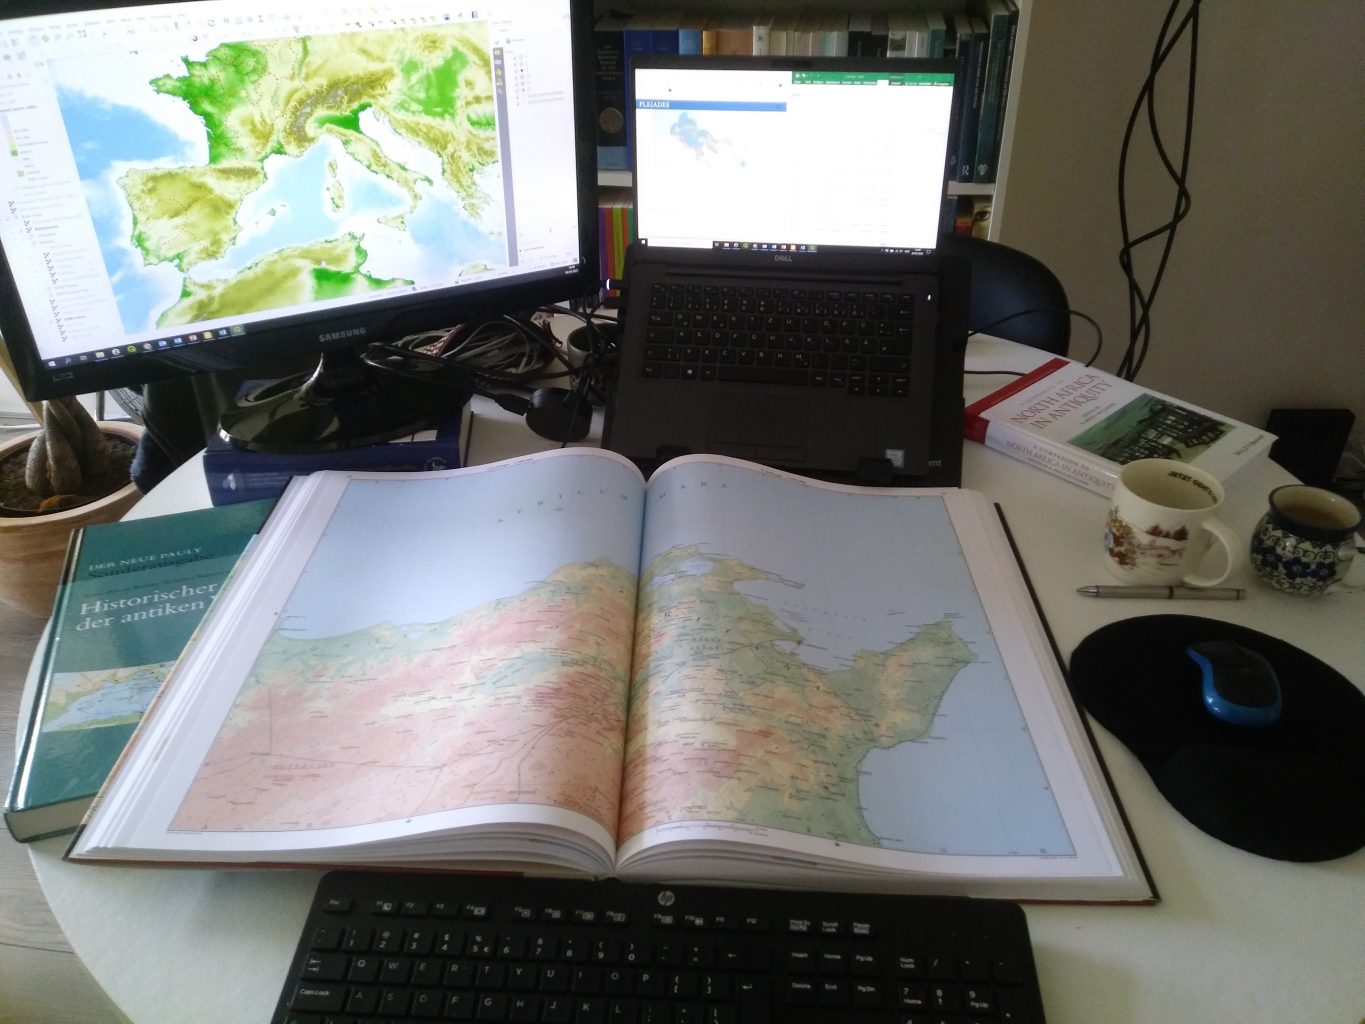
ATLAS in our project name has led people to ask whether this refers to the Atlas mountains. This interpretation fits the project nicely, our study regions are indeed on both sides of the mountain range. However, it is not the first meaning of the project name, although a nice one. The name refers to the ‘atlas’ of Late Antique cities that we create and use for the analyses of urbanism between the 3rd and 8th century. We put atlas between inverted commas for a reason. You shouldn’t expect an atlas in the style of Der neue Pauly Historischer Atlas der antiken Welt or the Barrington Atlas. Our project is not creating a printed Atlas, but rather an online tool for geographical analyses (our WebGIS) that will focus on our ten case study cities. And if time and funding permit we might be extending our scope…
Find our WebGIS online
Our WebGIS permits us to publish our results, just like a printed Atlas. However, in the process the WebGIS allows us to query and analyse our dataset. As you might have read in earlier blogs ([1 on Baelo]; [2 on Emerita]). The WebGIS runs on a Huma-Num server and is created and maintained by two database managers from the Université de La Rochelle. In the past we have worked with Frédéric Pouget and Alain Layec to create a way to link the WebGIS to our Zotero-library. Now we can easily add the bibliographical references to our data from Zotero. The next step, which was finished last week, is the importation of epigraphic data directly from a csv into the database. As we tweeted, before we were (and still are for the archaeological data) entering each inscription manually into the database. As this data can be obtained as csv from the Trismegistos database (through the licence of the University of Hamburg), and improved upon via other databases and the epigraphic corpora, it is easier to work in a csv (this love some of our team members have for Excel-sheets is still being discussed).
For those interested to look at the work-in-progress, we have made available the WebGIS in a view only version, you can find via this link. A short explanation of its functionalities can be found below. You will find that Baelo Claudia, Emerita Augusta and Carthago are finished. If you encounter any errors or omissions, don’t hesitate to contact us!
Short user guide for the WebGIS
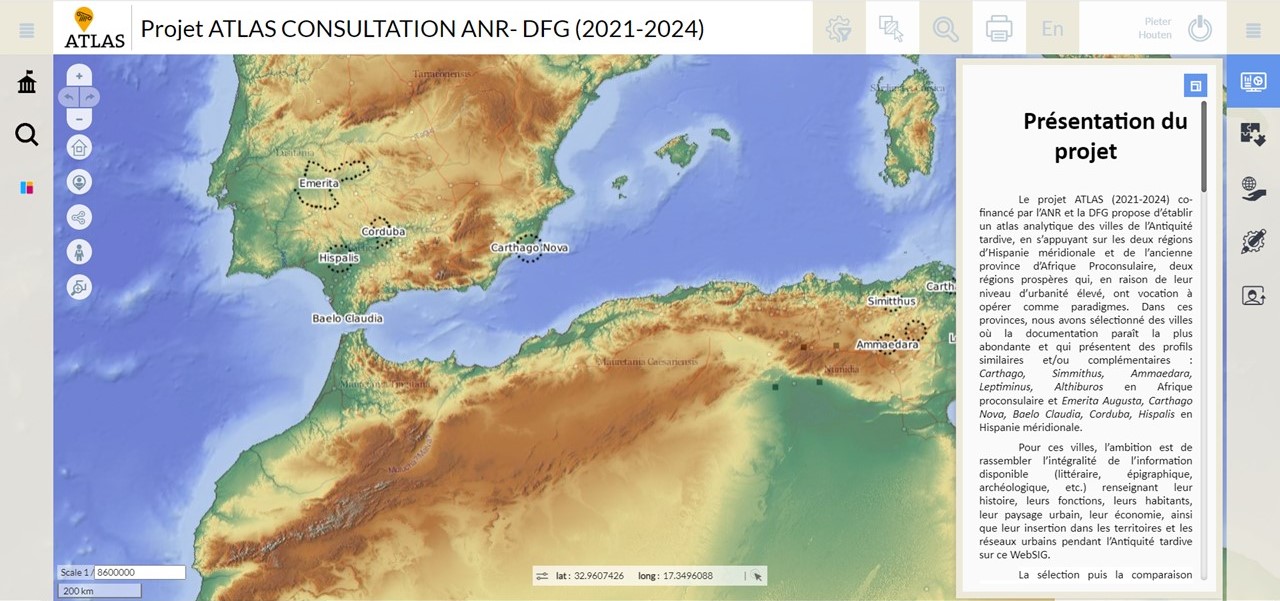
When you visit the WebGIS you will see the start screen with our research areas and case studies. You can zoom in on one of the case-studies and from zoom levels lower than 1: 1,000,000 (left lower corner you see the scale) the individual items corresponding with the epigraphic and archaeological evidence become visible. For instance the territory of Emerita:
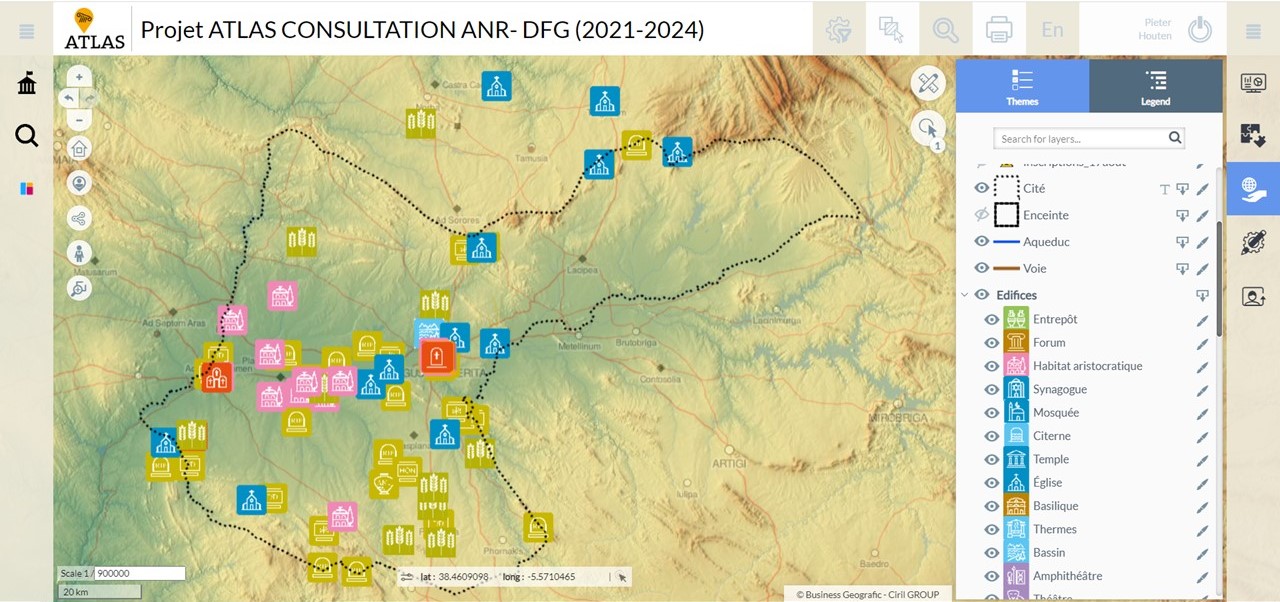
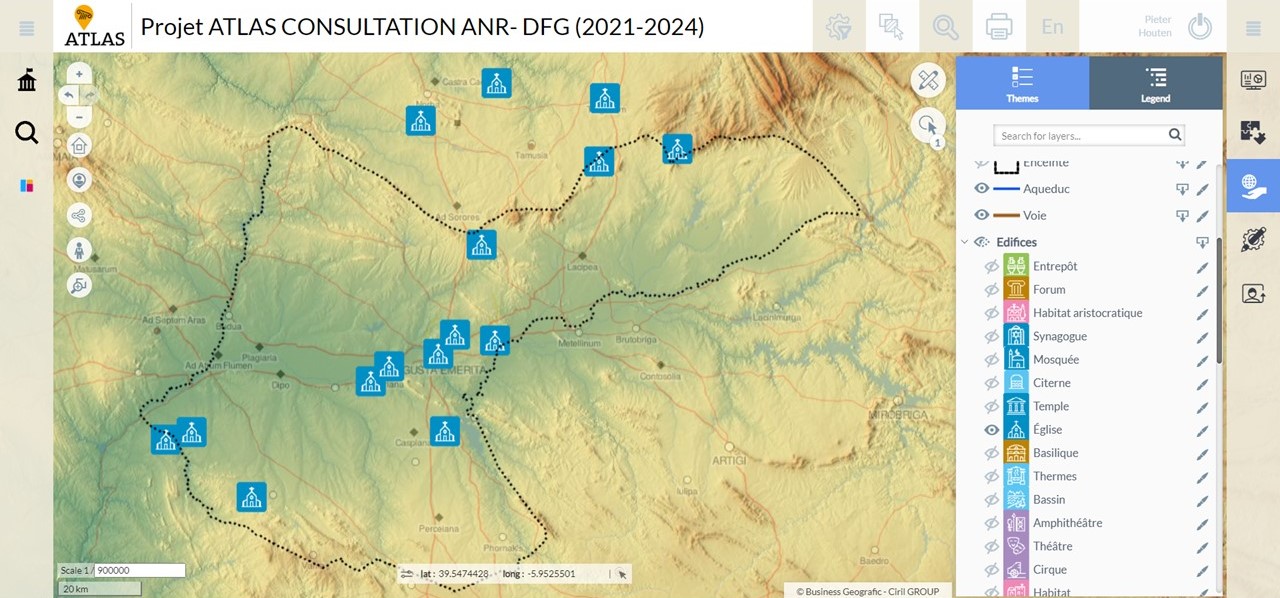
On the right hand side we can select the items on display by clicking the “Map” icon (the hand holding a globe). Here we can select and deselect items to show. For instance, to see only the churches within the territory of Emerita we deselect the epigraphy (click the eye on the left of “Inscriptions”). And as a quick option to get the churches we deselect all “Edifices”, then select only the “Église”. Now you should have the following image:
ATLAS Cartography
In addition to our WebGIS we are creating maps for some side projects and interests of our team members. As our directors run more than one project and our post-docs have more than one skill we are able to produce maps for our region covering topics beyond the scope of our project. In the past year we have created several maps for presentations and publications. However, as creating maps is quite some work and we have to keep our eye on the core research, we have decided to give the student assistants in Hamburg a QGIS-training. Thanks to the German part of the project we have a few students helping us with parts of the project. For example, all our French blogs are translations done by Lilian Fischer. In the past months Lilian Fischer, Tjaard Jantzen and Sebastian Meyer, have done several tasks for the project, such as: searching bibliography, data curation and entry.
As they have become acquainted with collecting data to create maps, it was time for the next step: Learning to make maps with QGIS. In the past weeks they have had the basic training from QGIS in Classics. This self-study course was created in 2020 as a TOLETUM Autumnschool. The students, accompanied by Lina Schimmelpfennig (student assistant of the RomanIslam Center), went through the modules and had a weekly meeting with Pieter (one of the developers of the course) to discuss issues and progress. The results of this course can be seen in our new section to the website.
Maps-to-go
In ATLAS we have been committed from the beginning to an open access policy with respect to all the output of our project. For this reason we have also decided to provide the maps that we have been creating during this time for the community. You can find them on the new section of our website: Maps-to-go.
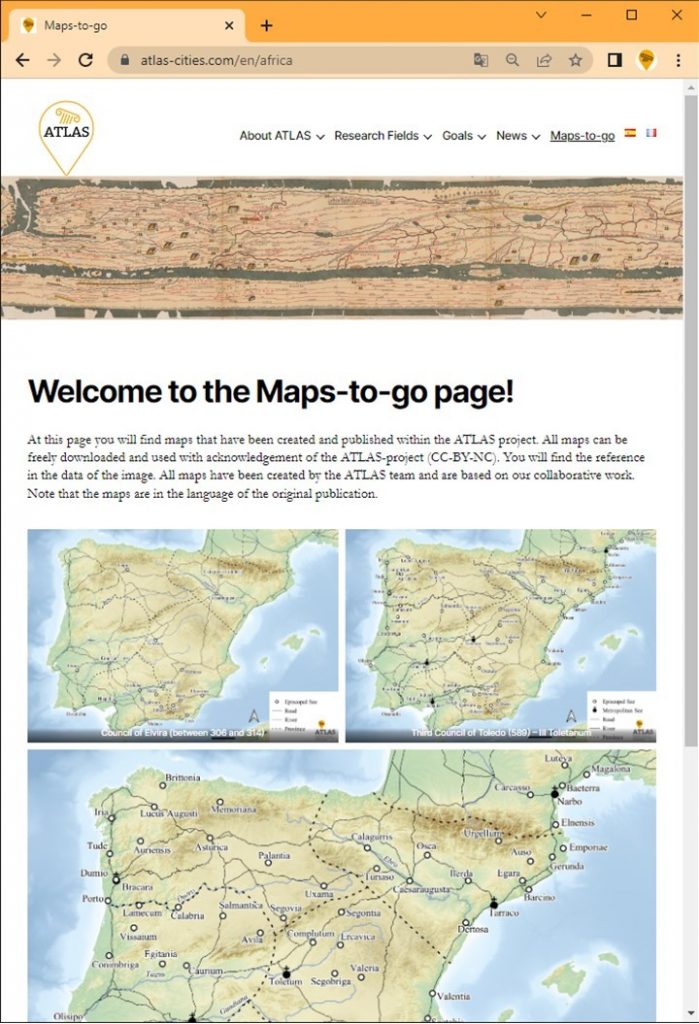
In this section you will find maps that have been created by our ATLAS team and are based on research done by our team members or experts related to the ATLAS project. The base layer for our maps might look familiar: we are using a WMTS-layer following the style of Digital Atlas of the Roman Empire. You are free to use the maps under CC-BY-NC, meaning that you can use (and change) them with reference to the ATLAS-project. This means you can use the maps as a base for your own work, as long as you refer to us. In the next two years of the project we will continue to upload new maps based on our research. Stay tuned to our Twitter-account for the latest cartographic news!